
Quick Take
Bitcoin’s month-long rally pushed spot prices to $109.7K while futures, options, and ETF-related flows all turned supportive. Short-term technicals remain overbought, yet derivatives funding and on-chain sentiment point to only modest speculative excess. Key supports sit at ~$97K and ~$103K; a daily close above $112K would open room toward the $118K–$120K Fibonacci cluster.
1. Price Action & Classical Trend Gauges
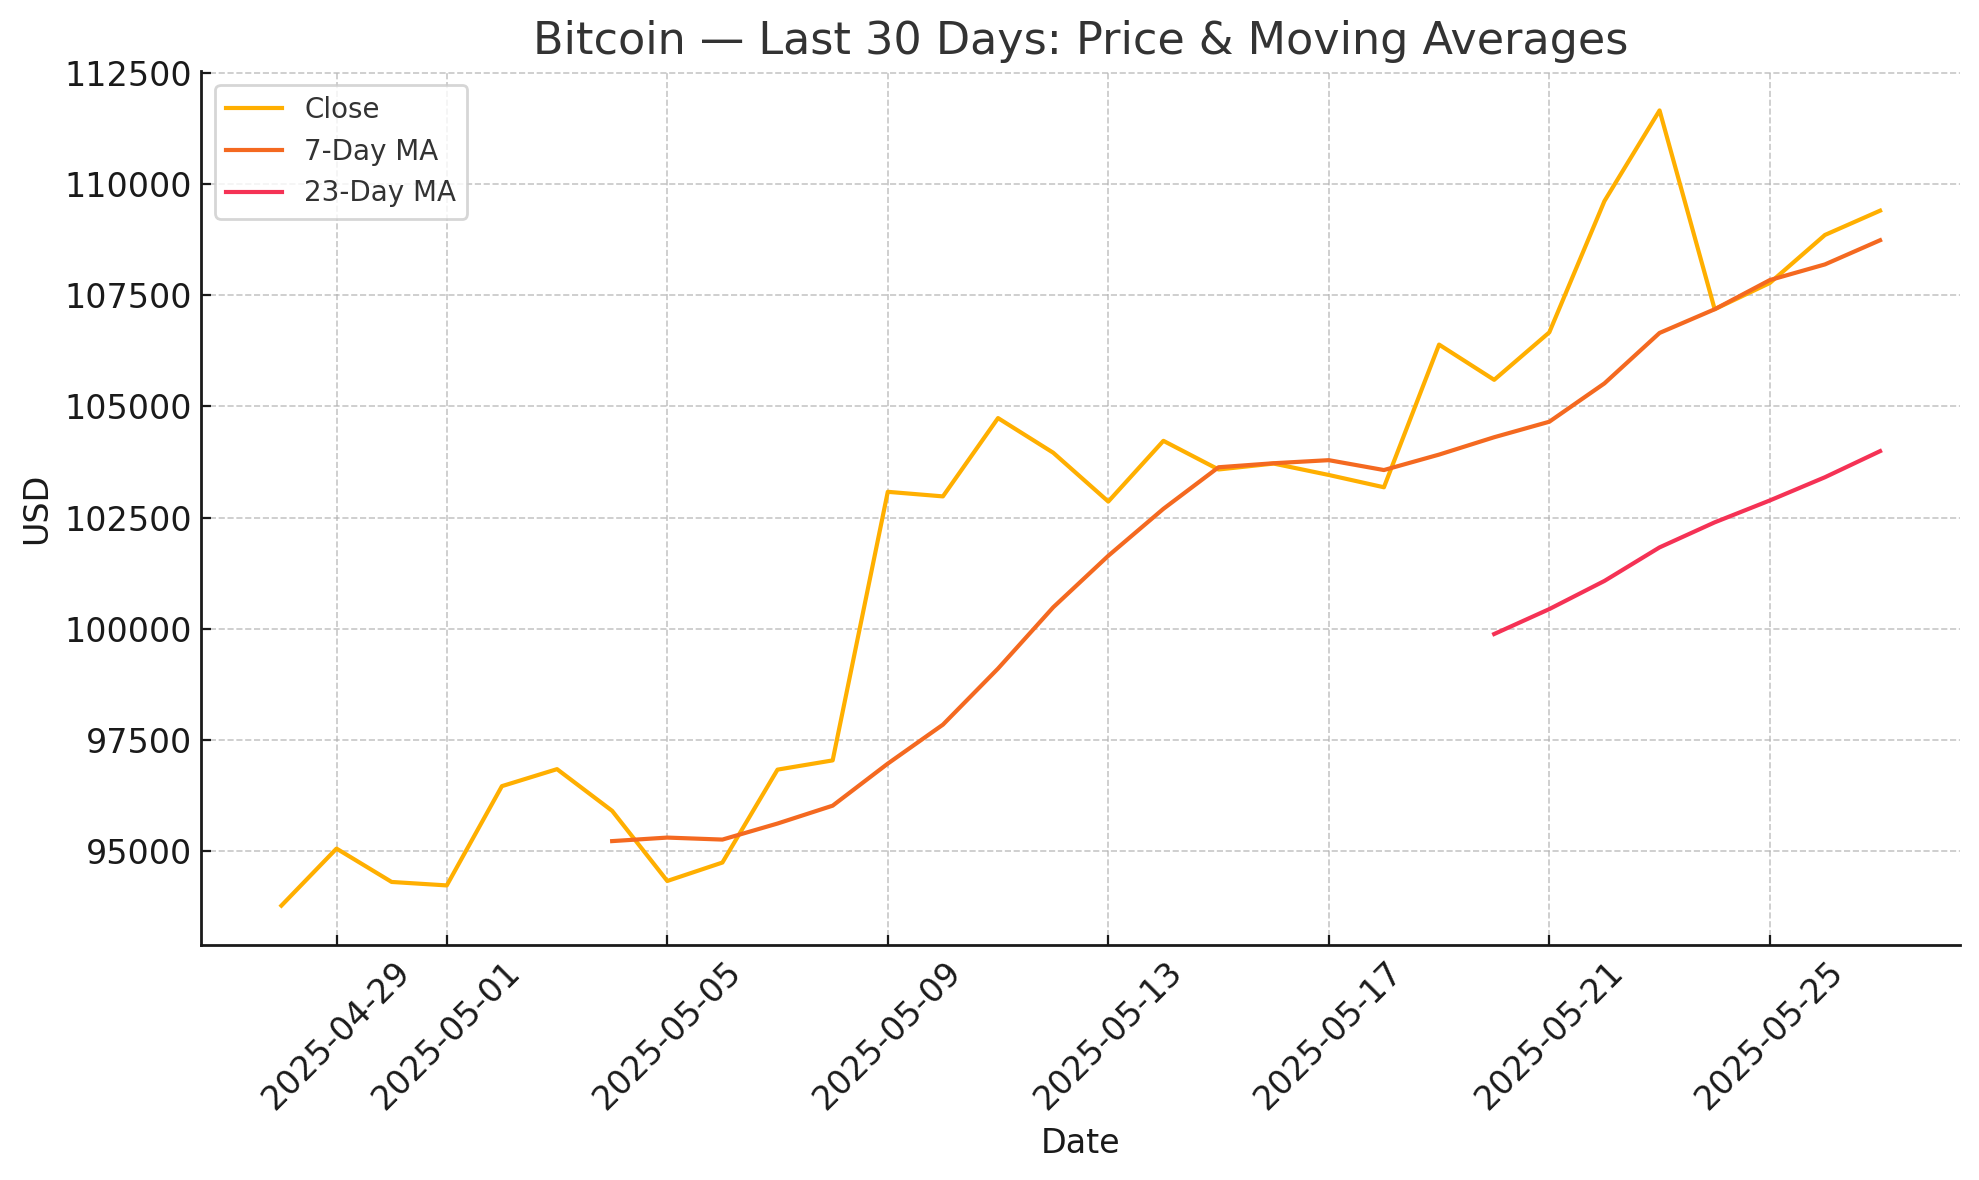
- Spot trades near $109,680 after a 17% mid-May surge that accelerated once price pierced the 7-day moving average; the 23-day MA is now curling higher, showing healthy trend confirmation.
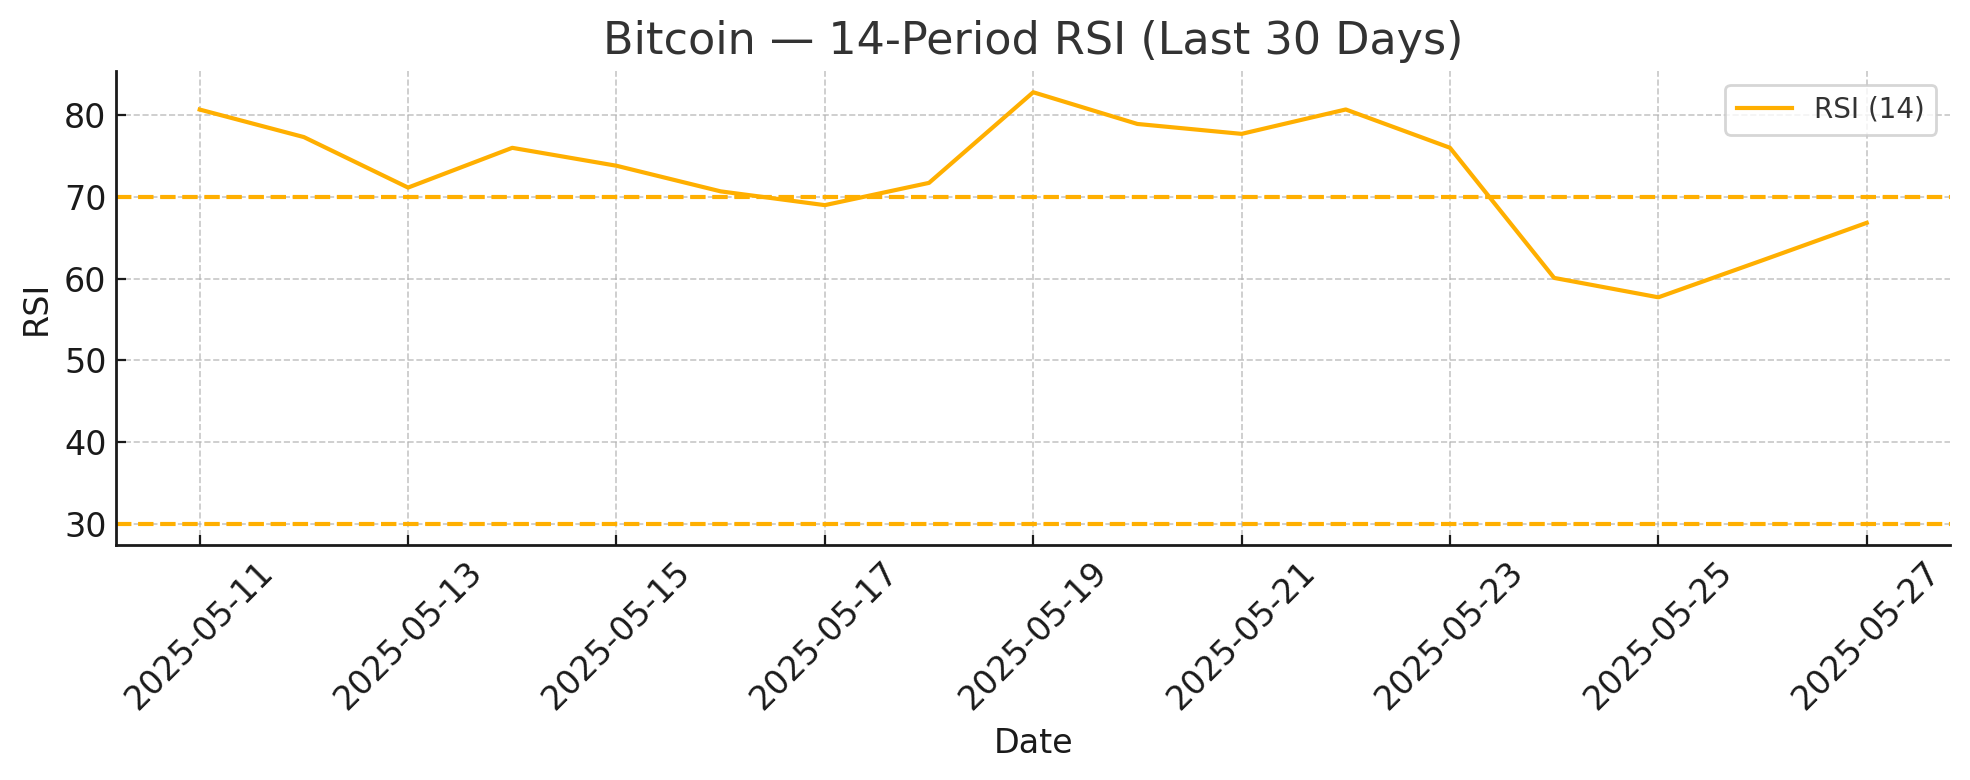
- The 14-period RSI cooled to ~67 after printing 83 on 21 May, easing out of extreme overbought territory while still in bullish-momentum mode.
- Support / resistance:
- $103K – prior breakout shelf & 7DMA cluster.
- $97K – 38% May retracement and mid-month volume node.
- $112K – May high; a daily close above extends target to $118K Fib 1.272.


2. Derivatives Positioning
| Metric | Latest Reading | Market Take |
|---|---|---|
| Total futures OI | ~$25B (all exchanges) | Continues to grind higher without sharp spikes, suggesting orderly leverage build-up |
| Perp funding-rate avg | +0.014% / 8h | Neutral-to-slightly-long-biased, far below +0.10% euphoria bands |
| 24h long/short ratio | 1.10 | Balanced; no crowd tilt into longs yet |
| Options OI (Deribit) | $17.8B, record high | Growing demand for upside calls into Q3 expiries |
Take-away: rising open interest paired with tame funding shows directional conviction without runaway leverage.
3. On-Chain & Macro Flow Signals
- Spot-ETF flows flipped positive again: +$220M cumulative over the last three sessions, ending a week-long outflow streak.
- Supply distribution (Glassnode): long-term holder coins continue net-dishoarding at the margin while exchange balances stay flat — signaling rotation into ETFs rather than outright selling pressure.
- Weighted social sentiment just turned positive (+0.35), the first sustained uptick since early April, hinting at improving crowd mood without euphoria.
- TVL on Bitcoin DeFi sidechains sits near $6.65B, adding 0.2% in 24h; modest growth supports a “risk-on” crypto backdrop without overheating.
4. Comprehensive Technical Picture
- Momentum: MACD histogram remains positive on the daily chart, with the signal line lagging price by ~4 days — a classic late-cycle momentum profile.
- ADX / DMI: ADX at 32 with +DI above −DI confirms a trending environment; however, a plateau in ADX warns of possible consolidation ahead (TradingView reading).
- Ichimoku: Price holds well above the cloud; a bullish TK-cross occurred 13 May, still active.
- BB Trend & Bollinger Bands: Bands have widened to 10-week extremes; BB Trend oscillator flipped positive on 19 May and remains elevated — historically a precursor to either continuation surges or volatility squeezes back into the mean.
5. Strategy Snapshot
| Horizon | Bias | Invalidations | Targets |
|---|---|---|---|
| 1-week swing | Neutral-to-bullish while price > $103K | Close | $112K, then $118–120K |
| Intraday | Range-trading between $107K support & $110.7K resistance | 4h close beyond either edge | Breakout gives 2.5% measured move |
A dip into the $103–105K pocket would reset intraday momentum without breaking the medium-term uptrend. Conversely, sustained closes above $112K could invite momentum-chasing flows from ETF buyers and options-desk hedging, extending toward the psychological $120K handle.
Momentum remains with the bulls, but the market must absorb overbought readings before any decisive push higher. A clean daily close above $112K would confirm breakout strength, unlocking the $118K–$120K Fibonacci cluster, while failure to hold the $103K–$105K shelf could invite a deeper, healthy reset toward $97K. With ETF inflows back in the green and leverage still orderly, the near-term path of least resistance favors gradual upside—as long as traders respect clearly defined risk levels.


Leave a Reply