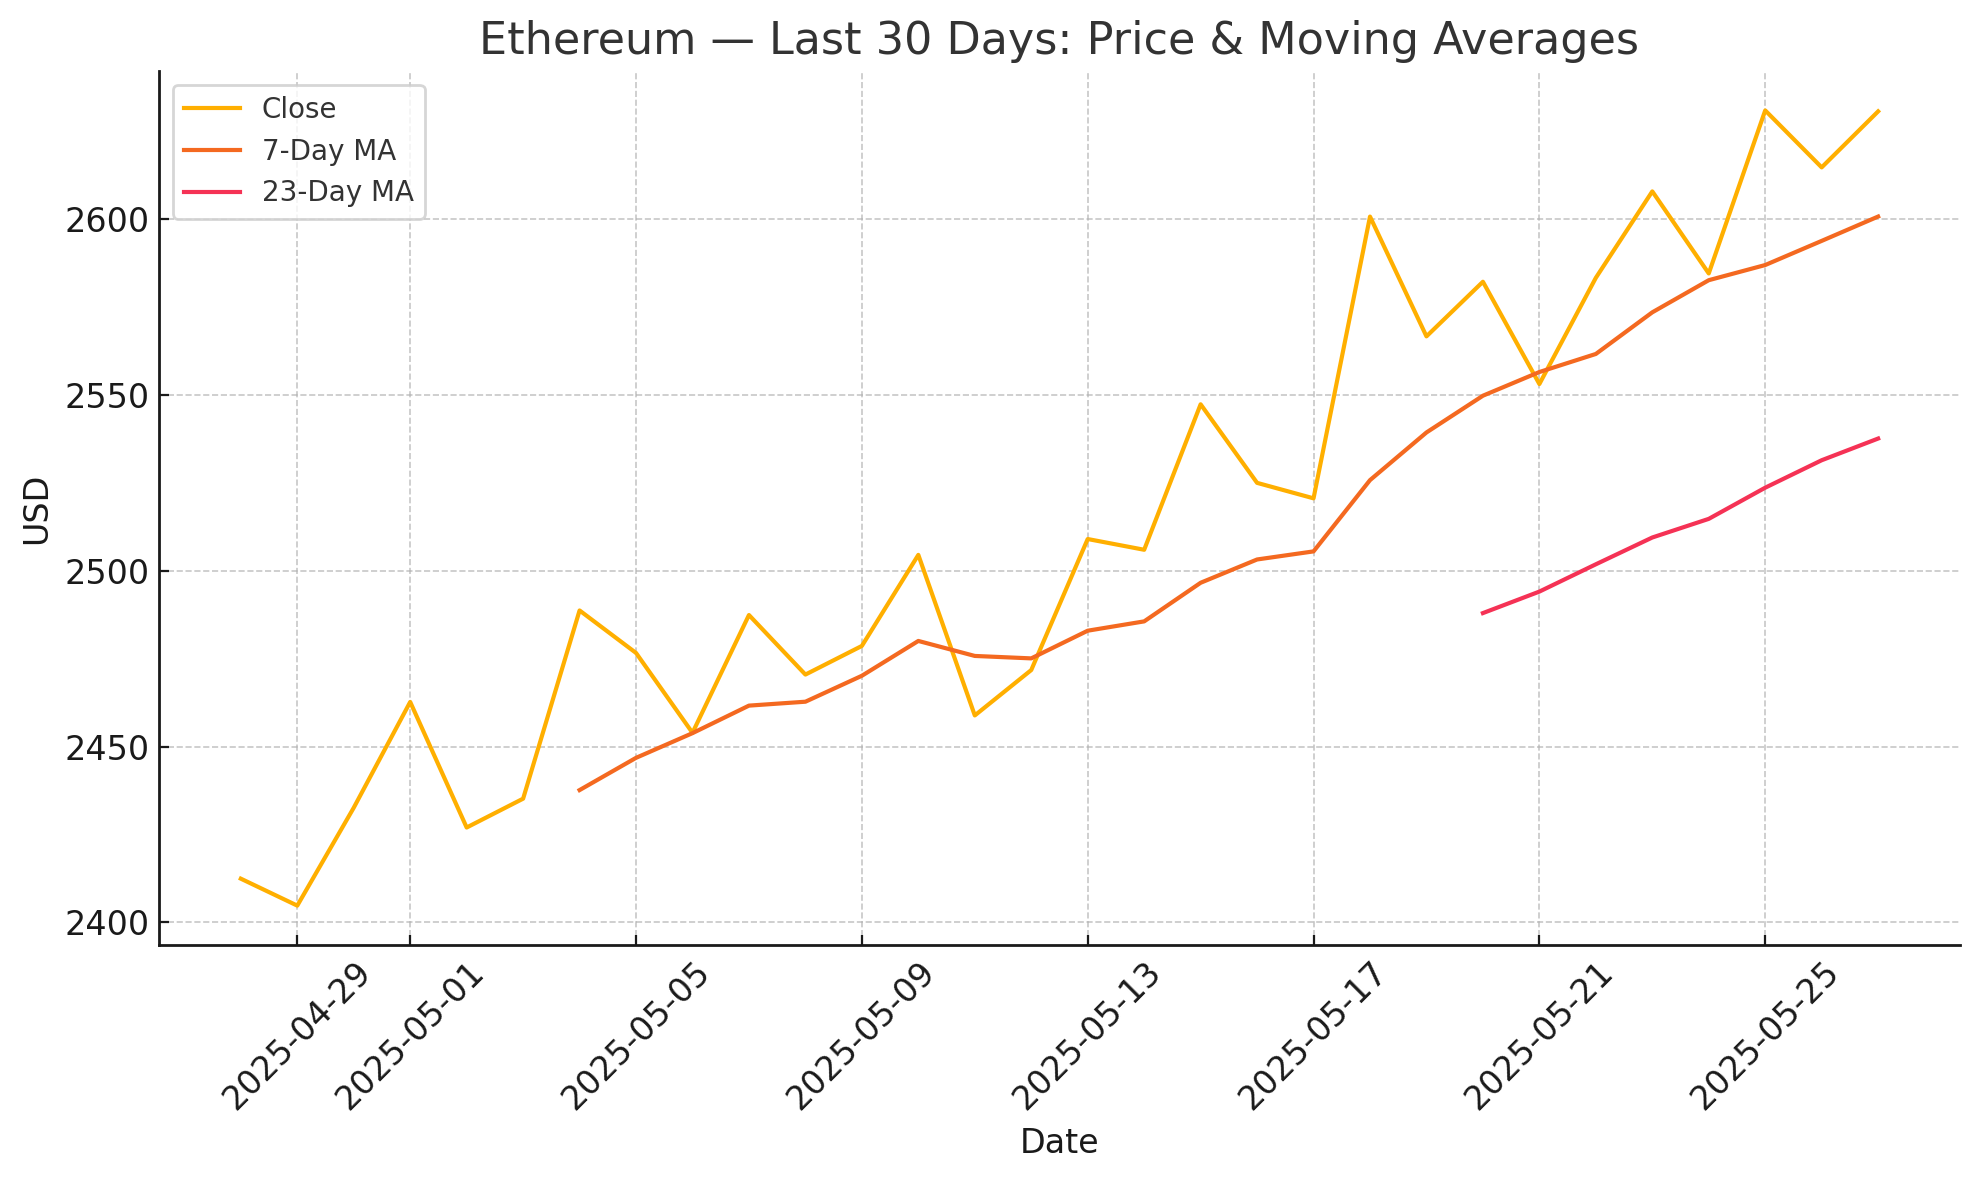
Ethereum has climbed back to the $2,630–$2,650 zone on a steady month-long uptrend, buoyed by record derivatives interest, recovering ETF inflows, and a sharp rise in network activity following the “Pectra” upgrade. Leveraging a full toolkit of technical, on-chain, and derivatives indicators—as well as the accompanying charts above—this report maps ETH’s supports and resistances, gauges sentiment, and sketches probabilistic price targets into early summer.
1. Spot Price & Momentum Snapshot
- Current price: $2,638 (DefiLlama)
- 7-day MA is rising and has crossed above the 23-day MA, confirming a constructive short-term trend.
- 14-period RSI sits near 65—bullish but not yet overbought, leaving room for an upside extension (TradingView).
- Immediate support clusters: $2,550 (7DMA) and $2,430 (38% May retracement).
- Overhead resistance: $2,700 daily close; beyond that, $2,880 (0.5 Fib of the Nov-to-April range).

2. Derivatives Positioning
| Metric | Latest Reading | What It Means |
|---|---|---|
| Perp funding-rate avg | +0.010% / 8h (CoinGlass) | Lightly long-biased, far from frothy levels. |
| Aggregate futures OI | Near record $22B, up 23% since April | Leverage building, but pace still orderly. |
| Options OI (CME) | Open interest in CME Ether futures held near all-time highs as of May 19 | Institutional demand remains firm. |
3. On-Chain & Macro Flow Highlights
- Spot-ETF flows: After a bumpy launch, cumulative net outflows have slowed to ≈$410M and are stabilizing.
- Supply distribution: Santiment whale dashboards show continued accumulation by 10k+ ETH wallets, while exchange balances sit at a 10-year low.
- TVL: Ethereum DeFi TVL has risen to $63B, adding 1.7% in 24h and underpinning fundamental demand for block-space (DefiLlama).
- Social sentiment: Weighted sentiment flipped positive last week, but is nowhere near euphoric extremes.
4. Technical Pattern Map
- Ichimoku Cloud: Price holds well above the daily cloud; a bullish TK-cross from early May remains intact.
- MACD: Histogram printed its fourth consecutive positive bar on May 26, signaling fresh momentum.
- ADX / DMI: ADX at 28 with +DI above −DI confirms a trending environment, though ADX plateau hints at consolidation risk ahead.
- Bollinger Bands: Daily bands have widened to ten-week extremes; a squeeze-and-break pattern favors continuation if price closes decisively above $2,700.
5. Strategy Grid
| Horizon | Bias | Invalidation | Target(s) |
|---|---|---|---|
| 1-week | Neutral-bullish while > $2,550 | Daily close | $2,700 ➜ $2,880 |
| Q3 swing | Bullish if > $2,430 | Weekly close | $3,200 (0.618 Fib) then $3,580 |
6. Price-Prediction Scenarios Into July
- Base case (60% probability): Gradual grind toward $2,880 as ETF flows turn net-positive and derivative leverage remains contained.
- Bull case (25%): Clean breakout above $2,880 sparks momentum-chasing flows, targeting $3,200–$3,300 where 2024 highs and a major Fib cluster converge.
- Bear case (15%): Macro risk-off event drags ETH back to cloud support at $2,200; structure remains constructive unless $2,000 fails.
Ethereum’s technical posture is constructive but not yet overstretched. A decisive daily close above the $2,700 threshold would confirm the next leg higher toward the $2,880–$3,200 zone, aligning with improving ETF flows and record-high institutional derivatives interest. Conversely, any dip into the $2,430–$2,550 pocket is likely to draw bargain hunters, provided macro conditions remain stable. With leverage steady and on-chain whales accumulating, the path of least resistance remains moderately upward into early summer—so long as bulls defend their newly won support levels.


Leave a Reply